HELP! I NEED SOMEBODY!
For more help, contact an Educational Technologist or Digital Media Tutor. Schedule an appointment or drop in!
Introduction
Adobe Illustrator is a great program for creating figures which are professional, customizable, and scalable. You have control over the look of your figures, and since Illustrator draws with mathematical vectors, you can easily scale the same figure for publication in any sized media, from journals to posters.
This guide has resources in three main groups:
 Figure 2.
You can use Illustrator to combine multiple graphs into a composite as well. Note figures like a, c, and e would be created from drawing tools, while figures like b, c, and f would be made using the graph tool and then further manipulated.

We're Here to Help
No matter which type of figure you are creating, know that if there's anything you would like to learn to do with your figure, or if it seems like there should be a better way to make the figure you want than what you know, you can reach out to our peer tutors in Burke Library and the KTSA, as well as our Educational Technology staff. Fill out the appointment form, or drop-in! [include links]
Illustrator Document Creation
Create a new document from File-->New. Make any changes you want to, such as changing the units to inches or centimeters—but you can change all these settings later as well.
Selection Tools
Select, Direct Select, and Group Select
Illustrator has two different selection tools, which work slightly differently, giving you a broad range of actions.
 The regular selection tool is black, and in this case, on the left. In a singlewide toolbar, it will be on top. This tool is used to select whole objects to move them, scale them, or adjust their properties and apply effects. You can also temporarily switch to the selection tool from any other tool by holding down cmd. It will switch back to whatever tool you had previously selected as soon as you release cmd.
On the other hand, the direct select tool (gray, on the right) is used to modify individual anchor points, paths, and handles within shapes. This allows you to correct mistakes and make adjustments. The easiest way to use the direct select tool is to first select the object using the selection tool and then select an anchor point to adjust using the direct select tool. You can select a single anchor point or multiple anchor points to change.
If you hold down the direct select tool, you can access the group select tool, which allows you to easily select all objects in a group. Watch the video below for a demonstration.
Artboard Tool
You can modify the artboard (the white area you draw on), or draw additional artboards, with the artboard tool. It’s fairly intuitive to use. You can also access and modify the artboards from Window-->Artboards, which gives you some additional options to explore.
Artboards are important for exporting image files (.jpeg, .png, .tiff) if you need a border around your image, or only want to export part of your figure, since you can use artboards to define the exported area.
Grids & Guides
Please see the Adobe Help page on Rulers, Grids, and Guides for more in-depth information.
Guides
Guides can help you make figures by giving you lines at precise locations to which you can snap objects.
To place guides, first you have to enable Rulers from View-->Rulers-->Show Rulers. Then simply click on the ruler and drag outward to create a guide.
You can also turn any object (line or shape) into a guide by selecting it and going to View-->Guides-->Make Guides
You can delete guides like any object, by selecting it and pressing the delete button. You can lock guides in place by right clicking on the artboard and selecting Lock Guides; unlock guides by right clicking the artboard and selecting Release Guides.
Grids
A grid can similarly help you lay out figures by displaying lines at set intervals.
To turn on the grid, go to View-->Show Grid. To change the size of the grid interval, go to Illustrator-->Preferences-->Guides & Grid and enter an amount in the Gridline Every field. You can enter amounts in inches (in), mm, or cm, even if Illustrator is displaying values in some other measurement, such as points (pt)—Illustrator will automatically convert the values appropriately.


Lines and Rectangles for Drawing Graphics
Illustrator has some powerful tools for drawing precise charts. If you’re creating a chart based off a photo or image from a lab, you can use these tools.
Line Tool 
Holding shift constrains line to 45° angles, for perfectly straight lines
Holding option/alt draws from the center
Holding space bar allows you to reposition the line while drawing it
Transform controls and the selection tools allow you to modify line after initial drawing
Rectangle Tool
The rectangle tool works similarly to the line tool, but creates enclosed rectangles, with a stroke and fill you can modify.
Holding shift constrains rectangle to a square
Holding option/alt draws from the center
Holding space bar allows you to reposition the rectangle while drawing it
Transform controls and the selection tools allow you to modify rectangle after initial drawing
NOTE: Video below works best in Chrome.
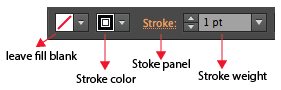
Stroke
If you look at the Control Panel when you have an object selected, you'll see the stroke controls on the left side. The width of a line, from either drawing or the shape tool, is determined by the stroke. By default, stroke is measured in points that increment by whole numbers, but you can type in decimal values.
After drawing a line, you need to add and modify the stroke. Do this by selecting the line with the 
Be careful when resizing your work. The strokes maintain their values (i.e. the stroke doesn't scale) UNLESS you scale using the Scale Tool dialog box and check Scale Strokes and Effects. To do so, select the tool from the toolbar ( ) and alt+click.
In the example below, you can see how the outline of the chicken looks odd when scaled down without using the Scale Tool dialog box.

Alignment Options
The alignment options allow you to quickly line up elements of your figure precisely.
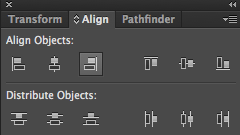
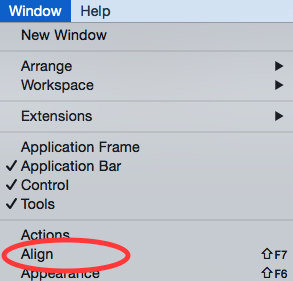
You can access the align panel from Window-->Align.
You can specify to align objects to your selection, a specific key object, or to the dimensions of the artboard. To indicate a "key object" to align to, click that object again after selecting Align to Key Object.

To access the Align To controls, you may need to click the flyout menu and Show Options.

Text and Images
Adding Images
You can drag images into Illustrator, or add them through File-->Place.
Area Type and Point Type
Area Type is made by dragging out a text box with the type tool, and it behaves like type in text boxes in most other programs: the text is constrained within the box; you can move the box around, resize it (changing the area the text is within), and thread the text to other text boxes.
Point Type is unique to Illustrator and can be created by simply clicking with the type tool and then typing. The text is only constrained to the initial point you clicked: if you center or right-align the text, it will do so with regard to that point. When typing in point type your text will continue along a single line—even going off the artboard—unless you press enter to start a new line of text. Point type treats text like an image: if you scale it, you'll change the text size, and you can easily rotate it to get upside-down or sideways text. This can be useful for labeling vertical axes.
If you hold shift while rotating point text, it will constrain the rotation to 45° angles.
Select the Graph Tool and either click+drag out a graph area by sight, or click once and enter in the exact size you want the graph to be (not including the legend and value/category information). Either way, a graph object and data field will appear. Copy + paste your data into the data field. The only file you can import is a tab-delimited text file (which you can save an Excel sheet as)—so in general, copy+paste is more expedient.

You can easy change colors, fonts, column width and spacing--anything about the graph can be changed somehow (if you don’t know how, you can ask a Digital Media Tutor or Educational Technologist).


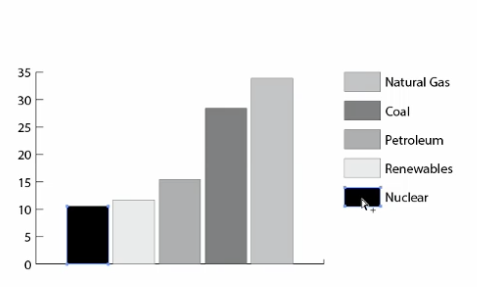
One useful trick is selecting subgroups—for example, all columns with the same color, and their corresponding legend key, are a subgroup, and you can quickly change the color of all of them! Using the white selection tool, click on one item in the subgroup (such as the legend key) and then hold alt (you should see a plus sign to the lower left of the cursor) and click on it again to select the subgroup.


You can hand draw error bars for bar graphs. You may wish to contact a Digital Media Tutor or Educational Technologist for specific instruction.
Draw a line of the appropriate length, based on your data. Select the line and open the Stroke panel (accessible by clicking Stroke in the menu bar.)

Change the arrowheads to flat error bar heads. You may wish to change the scale of the arrowheads (the scale is relative to the weight of the line and can be larger than 100%).

Position the error bar over the graph; duplicate and modify as needed. Proficiency with the line tool, alignment tools, and grouping can make this process quick and easy—so get help from a tutor or technologist!
Hamilton College, 198 College Hill Road, Clinton, NY 13323 • 315-859-4735 • Copyright © 2024 The Trustees of Hamilton College. All rights reserved.